Probability distribution
Descriptiopn
Standard deviation
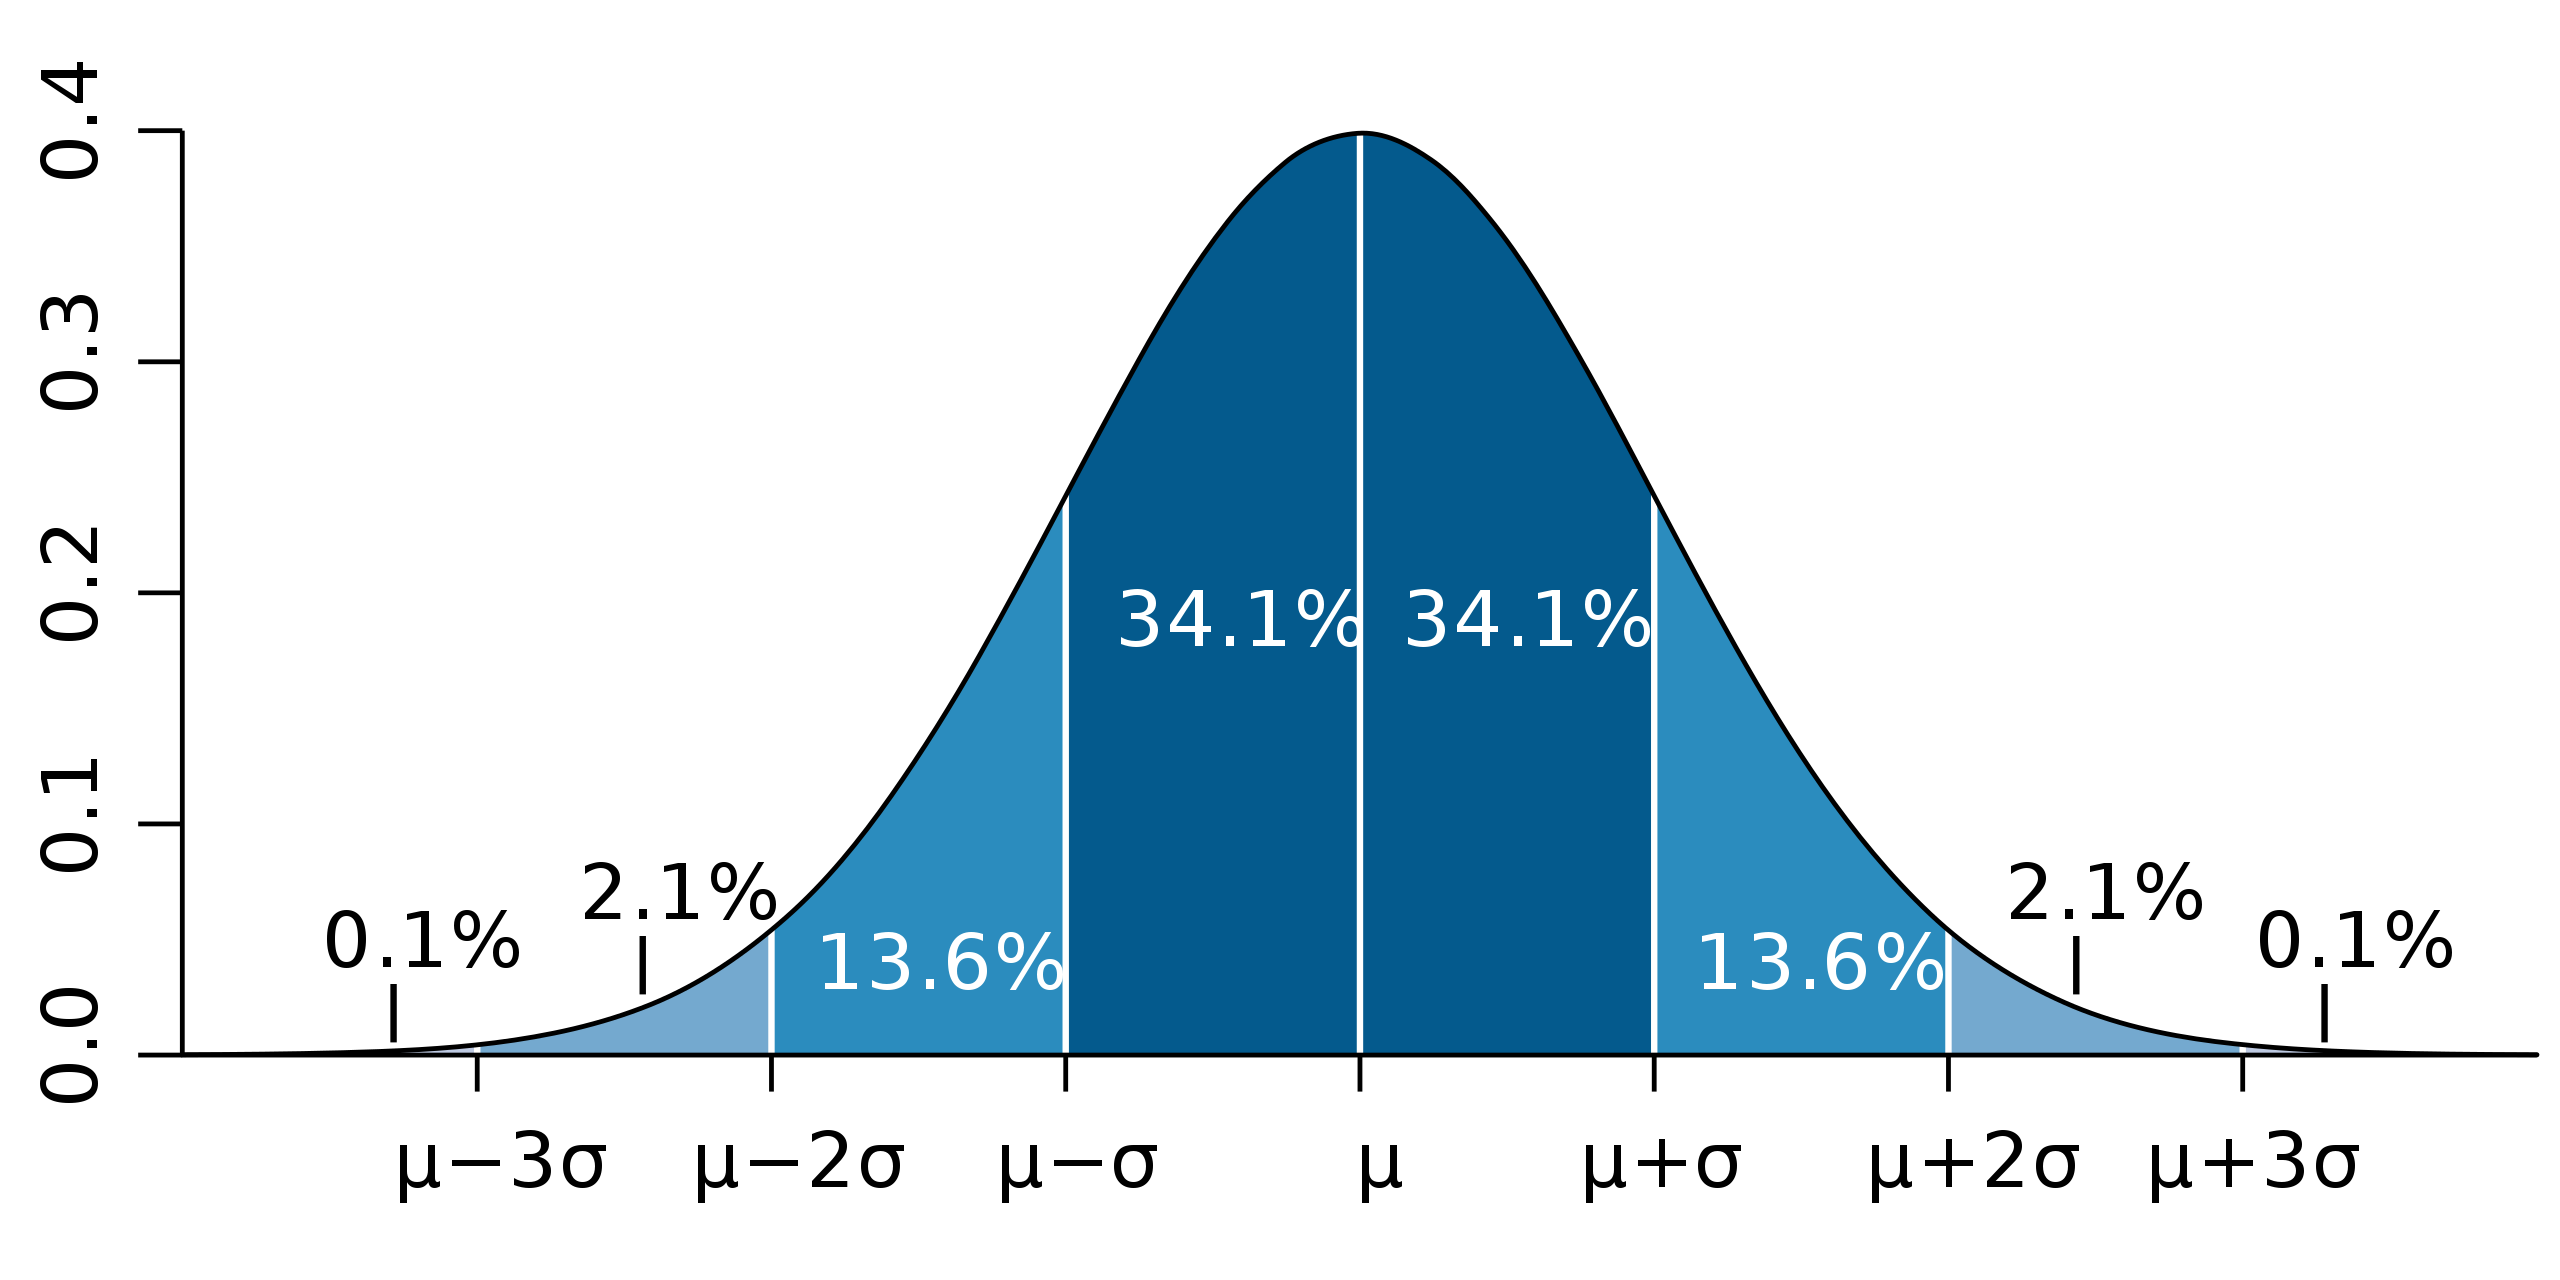
The probability density function (pdf) of the normal distribution, also called Gaussian distribution or "bell curve", the most important absolutely continuous random distribution. As notated on the figure, the probabilities of intervals of values correspond to the area under the curve.
In probability theory and statistics, a probability distribution is the mathematical function that gives the probabilities of occurrence of different possible outcomes for an experiment. It is a mathematical description of a random phenomenon in terms of its sample space and the probabilities of events (subsets of the sample space).
For instance, if X is used to denote the outcome of a coin toss ("the experiment"), then the probability distribution of X would take the value 0.5 (1 in 2 or 1/2) for X = heads, and 0.5 for X = tails (assuming that the coin is fair). Examples of random phenomena include the weather conditions at some future date, the height of a randomly selected person, the fraction of male students in a school, the results of a survey to be conducted, etc.